Représentation des fonctions de la variable complexe en Python
dimanche 20 juillet 2025
Petit interlude sans rapport avec les fractales.
1 – Comment associer à chaque nombre complexe une couleur
?from colorsys import hsv_to_rgb
from numpy import angle as arg, pi as π, log as ln
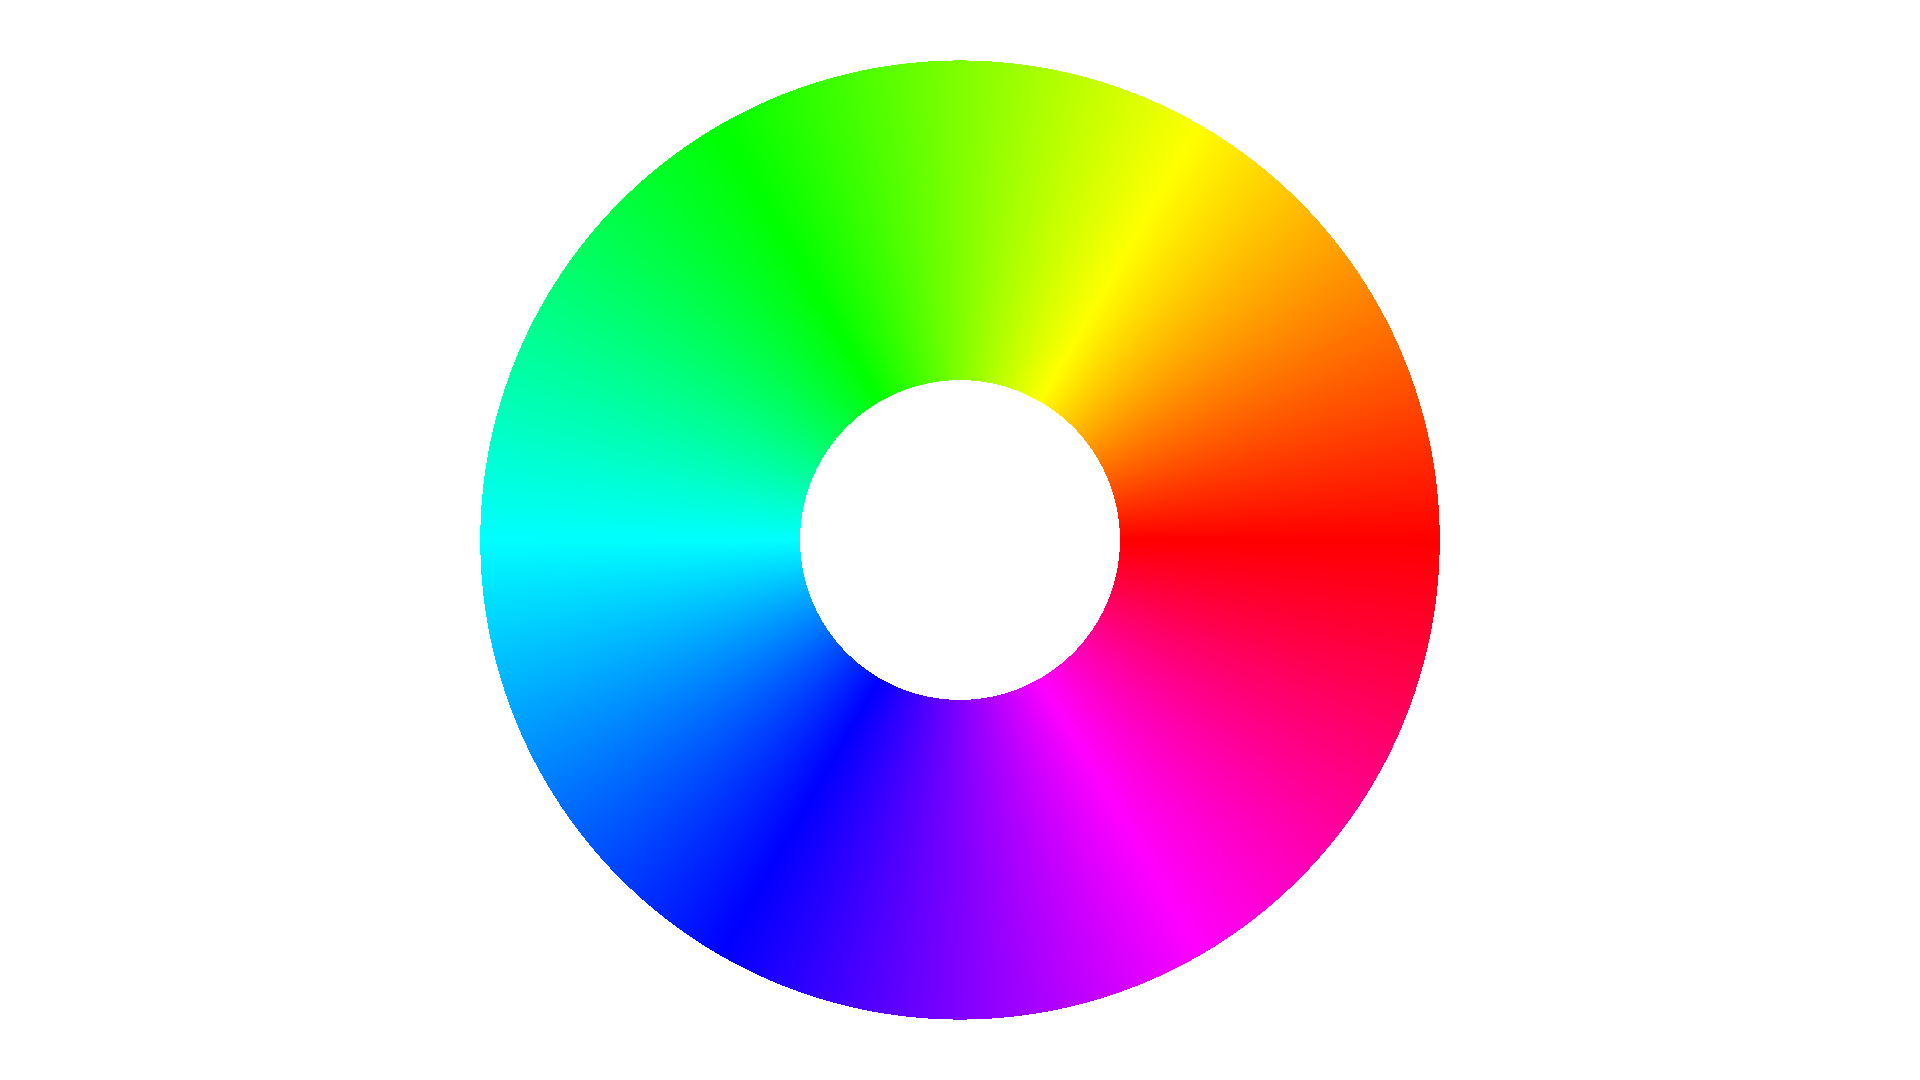
def CercleChromatique() :
I = CréerDessin(LARGEUR, HAUTEUR)
Centrer(0.0, 0.0, 3.0)
for px in range(LARGEUR) :
for py in range(HAUTEUR) :
(x, y) = PixelVersPoint(px, py)
m = abs(x + y * 1j)
if 0.5 < m < 1.5 :
θ = arg(x + y * 1j)
# Passages ]-π ; π] → ]-1/2 ; 1/2] → [0 ; 1[
h = θ / (2 * π)
if h < 0 :
h += 1
(r, g, b) = hsv_to_rgb(h, 1.0, 1.0)
# Passage [0 ; 1[³ → {0 ; ... ; 255}³
R = int(255 * r) ; G = int(255 * g) ; B = int(255 * b)
I.putpixel((px, py), (R, G, B))
Afficher(I)
>>> CercleChromatique()
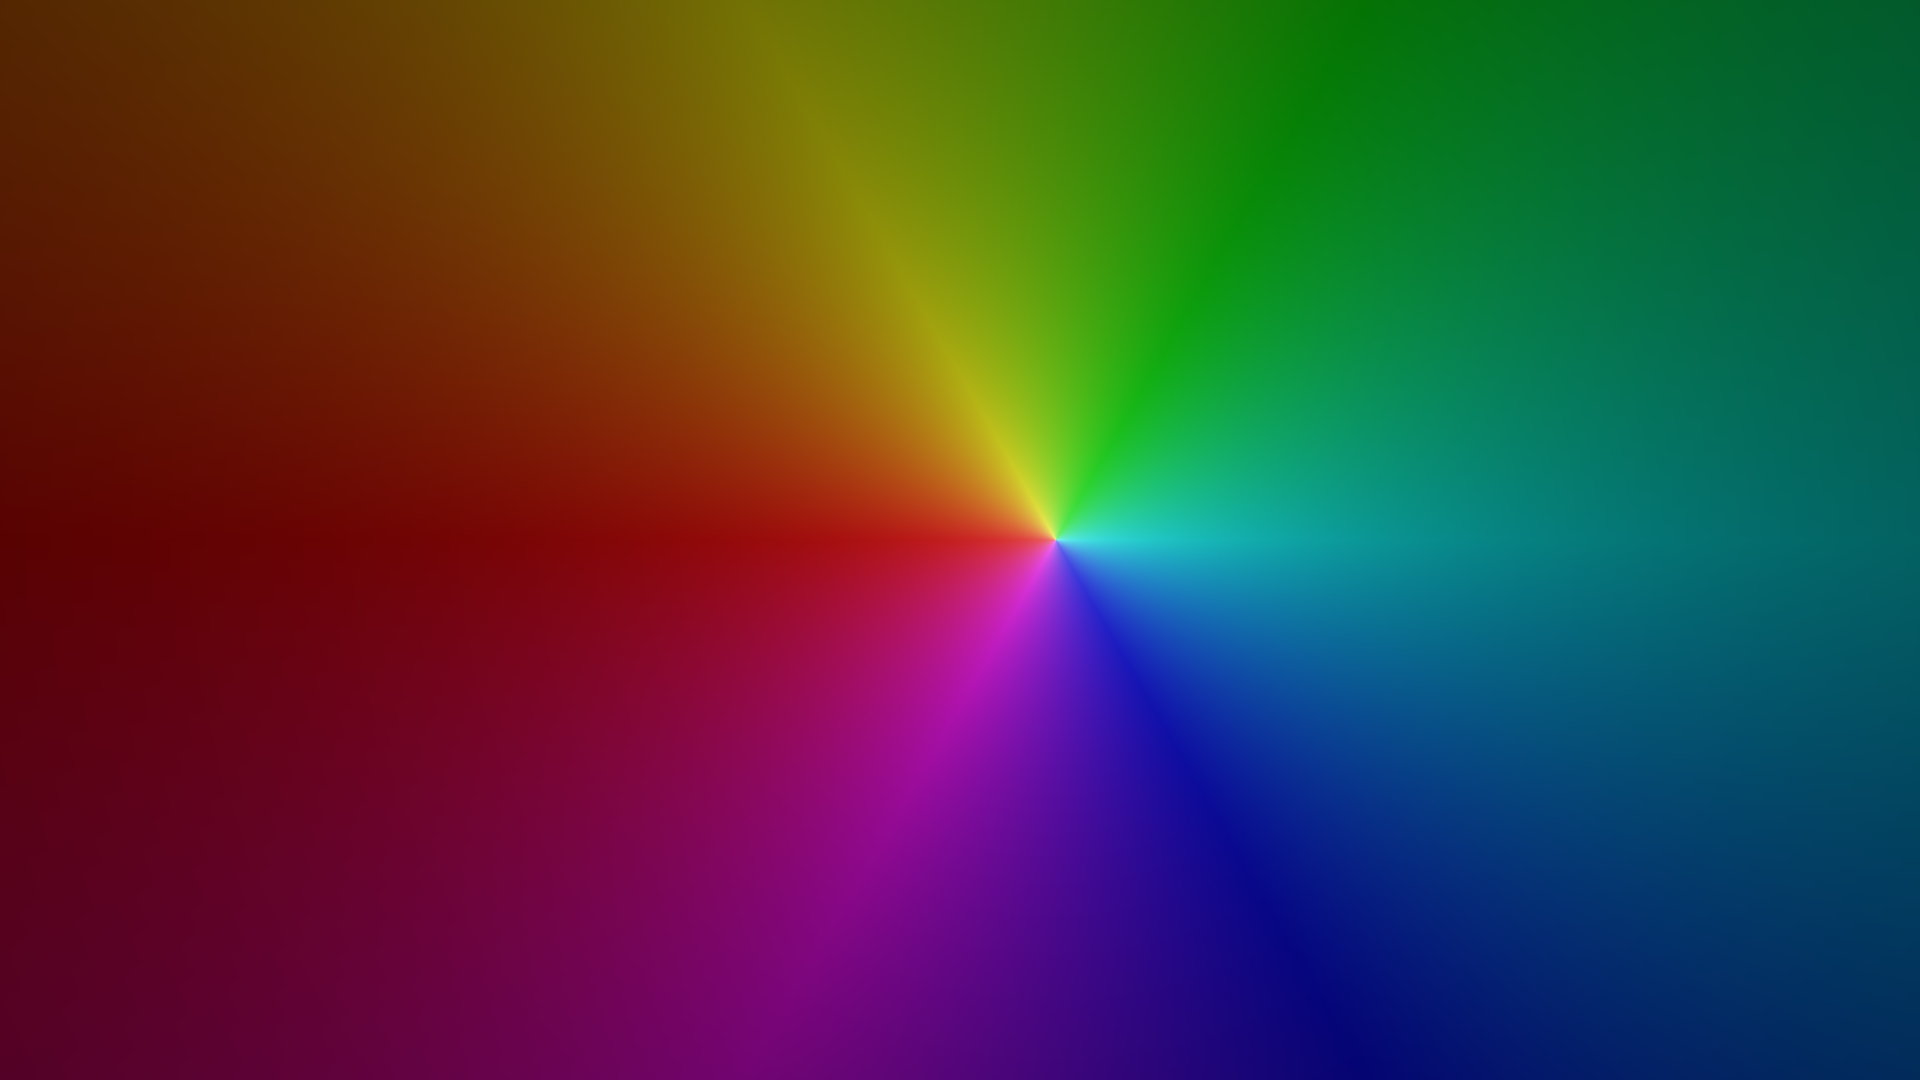
def CouleurDuComplexe(z) :
m = abs(z) ; ln_m_plus_1 = ln(m + 1)
h = arg(z) / (2 * π)
if h < 0 :
h += 1
s = 1 / (1 + 0.3 * ln_m_plus_1)
v = 1 - 1 / (1.1 + 5 * ln_m_plus_1)
(r, g, b) = hsv_to_rgb(h, s, v)
R = int(255 * r) ; G = int(255 * g) ; B = int(255 * b)
return (R, G, B)
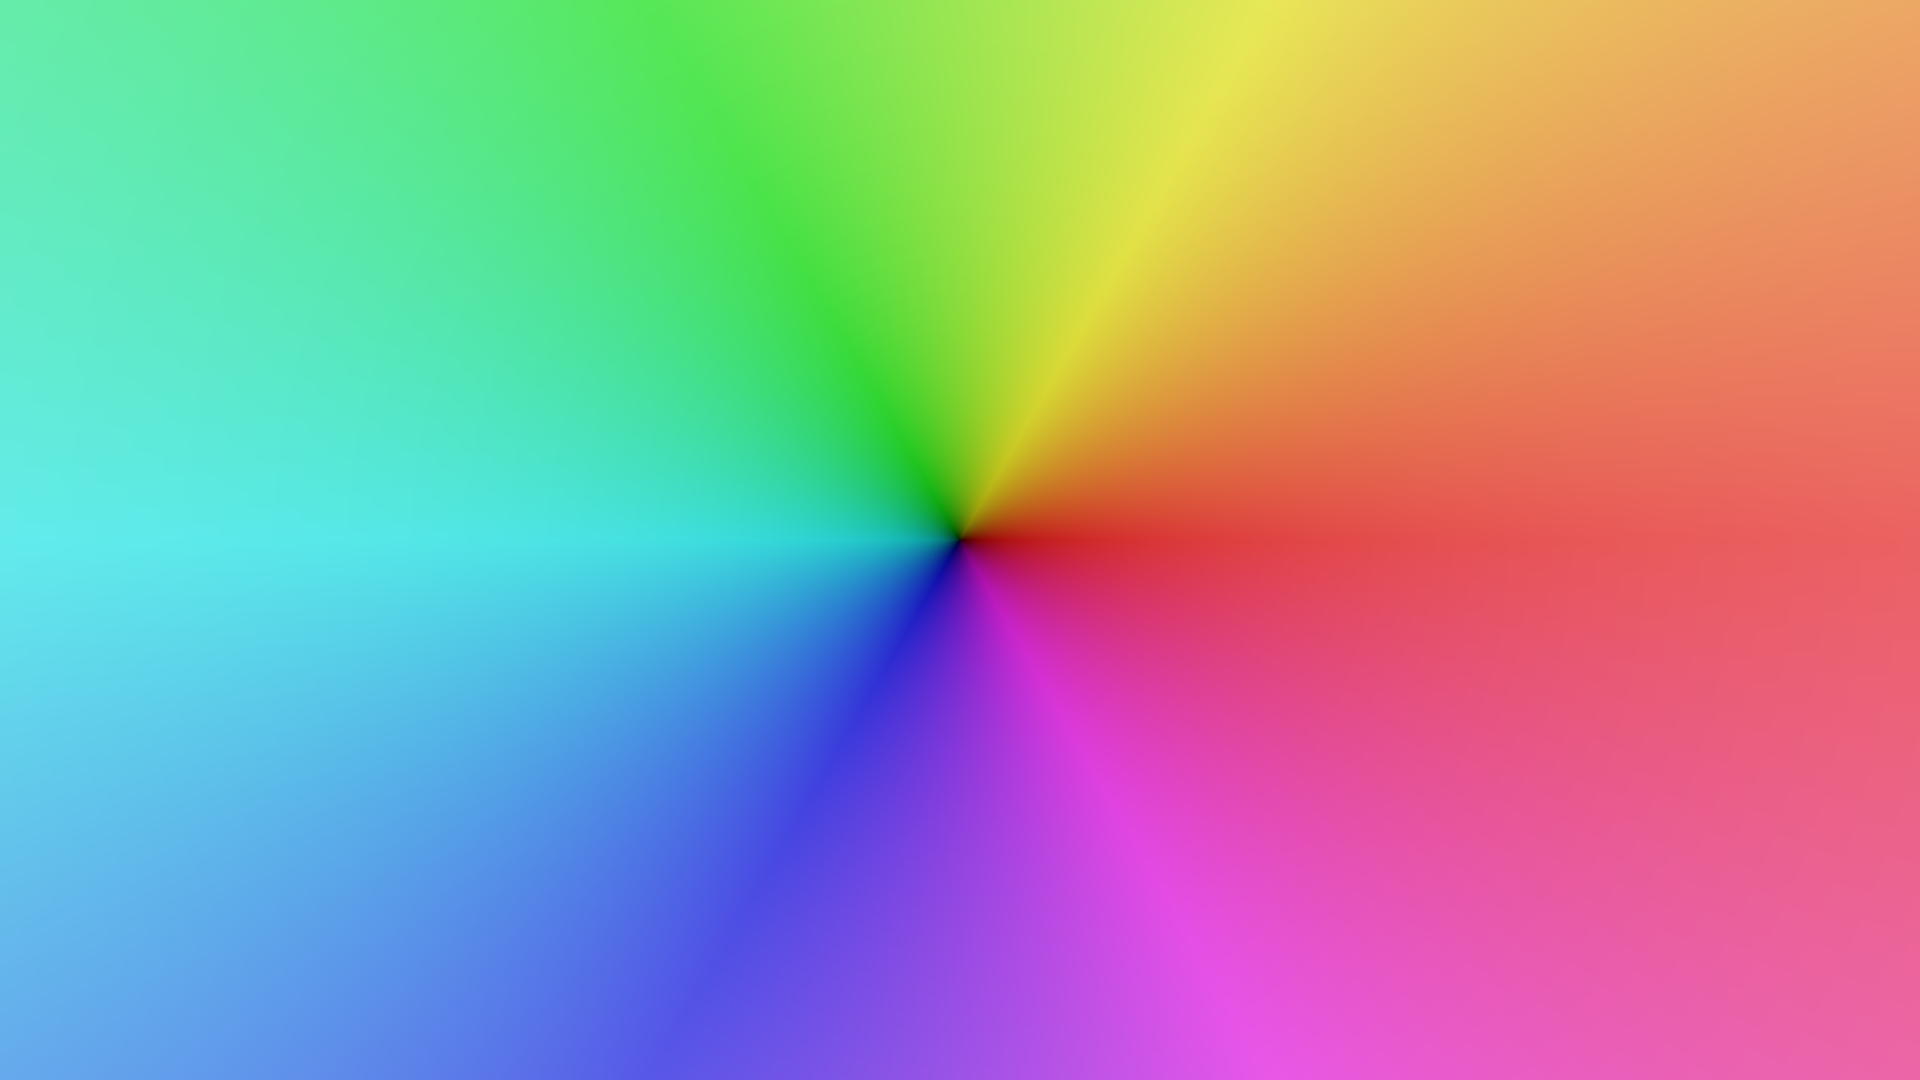
2 – Représentation des fonctions d'une variable complexe
?def ReprésenterFonction(f) :
I = CréerDessin(LARGEUR, HAUTEUR)
for px in range(LARGEUR) :
for py in range(HAUTEUR) :
(x, y) = PixelVersPoint(px, py)
Z = f(x + 1j * y)
I.putpixel( (px, py), CouleurDuComplexe(Z) )
Afficher(I)
>>> Centrer(0.0, 0.0, 10.0)
>>> ReprésenterFonction(lambda z : z)
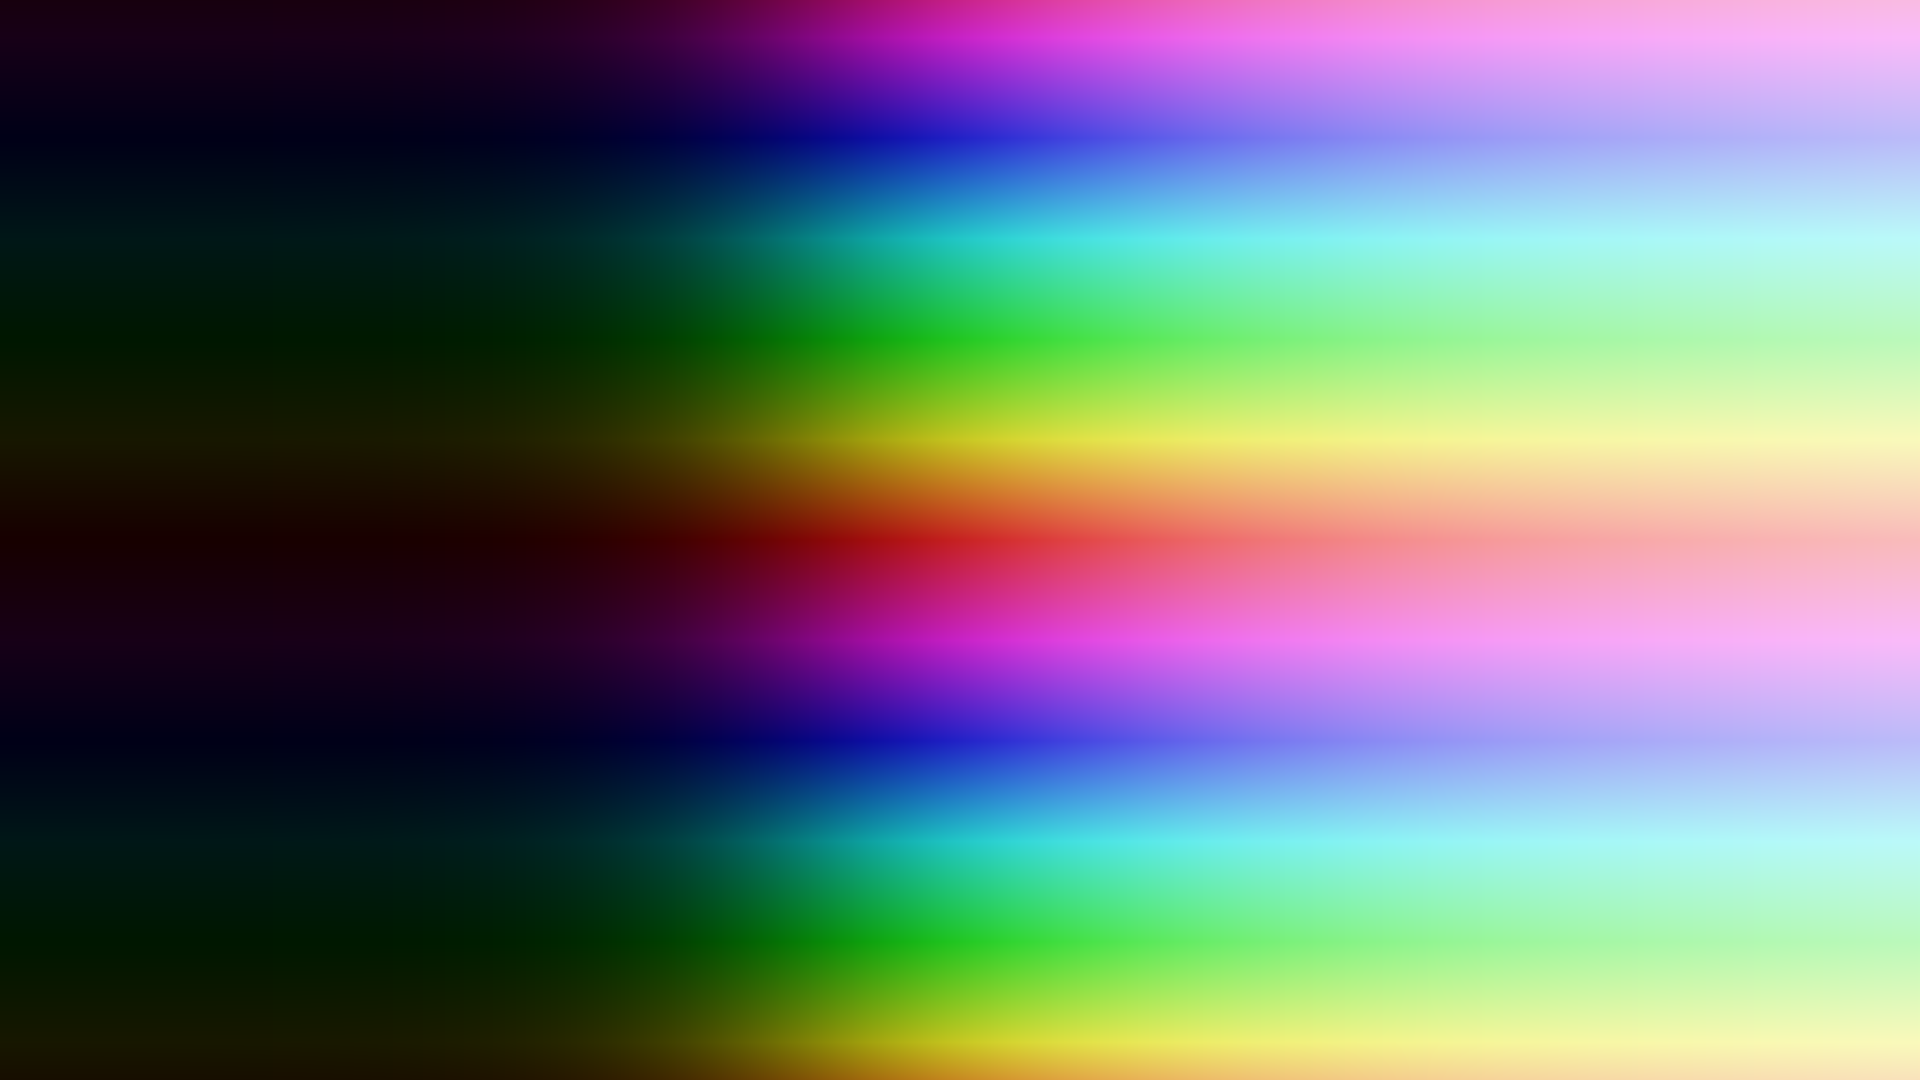
>>> Centrer(0.0, 0.0, 10.0)
>>> from numpy import exp
>>> ReprésenterFonction(exp)
>>> Centrer(0.0, 0.0, 10.0)
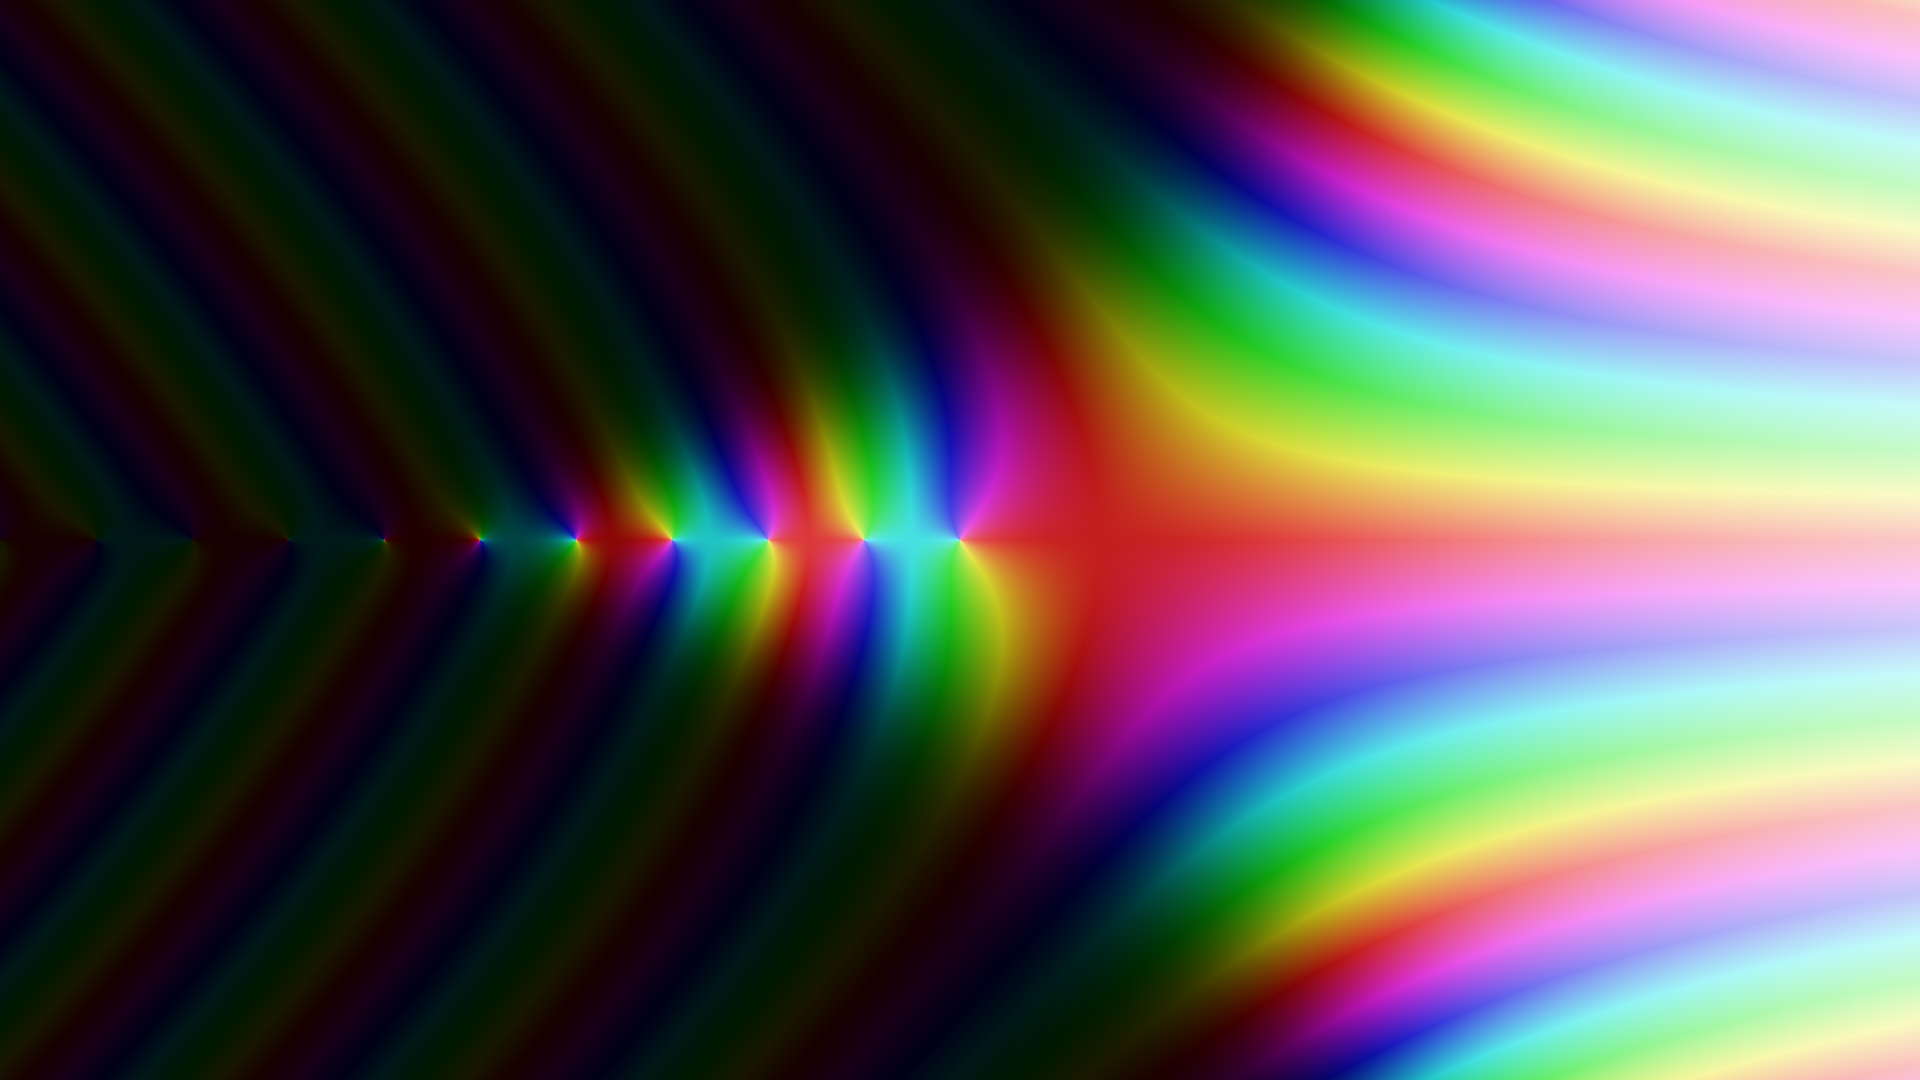
>>> from scipy.special import gamma as Γ
>>> ReprésenterFonction(Γ)
3 – Séries entières
?def SommeSérieEntière(a, N_MAX = 50) :
def f(z) :
Z = 0.0 + 0.0j
for n in range(N_MAX + 1) :
Z *= z
Z += a(N_MAX - n)
return Z
return f
>>> Centrer(0.0, 0.0, 10.0)
>>> f = SommeSérieEntière(lambda n : 1)
>>> ReprésenterFonction(f)
>>> Centrer(0.0, 0.0, 10.0)
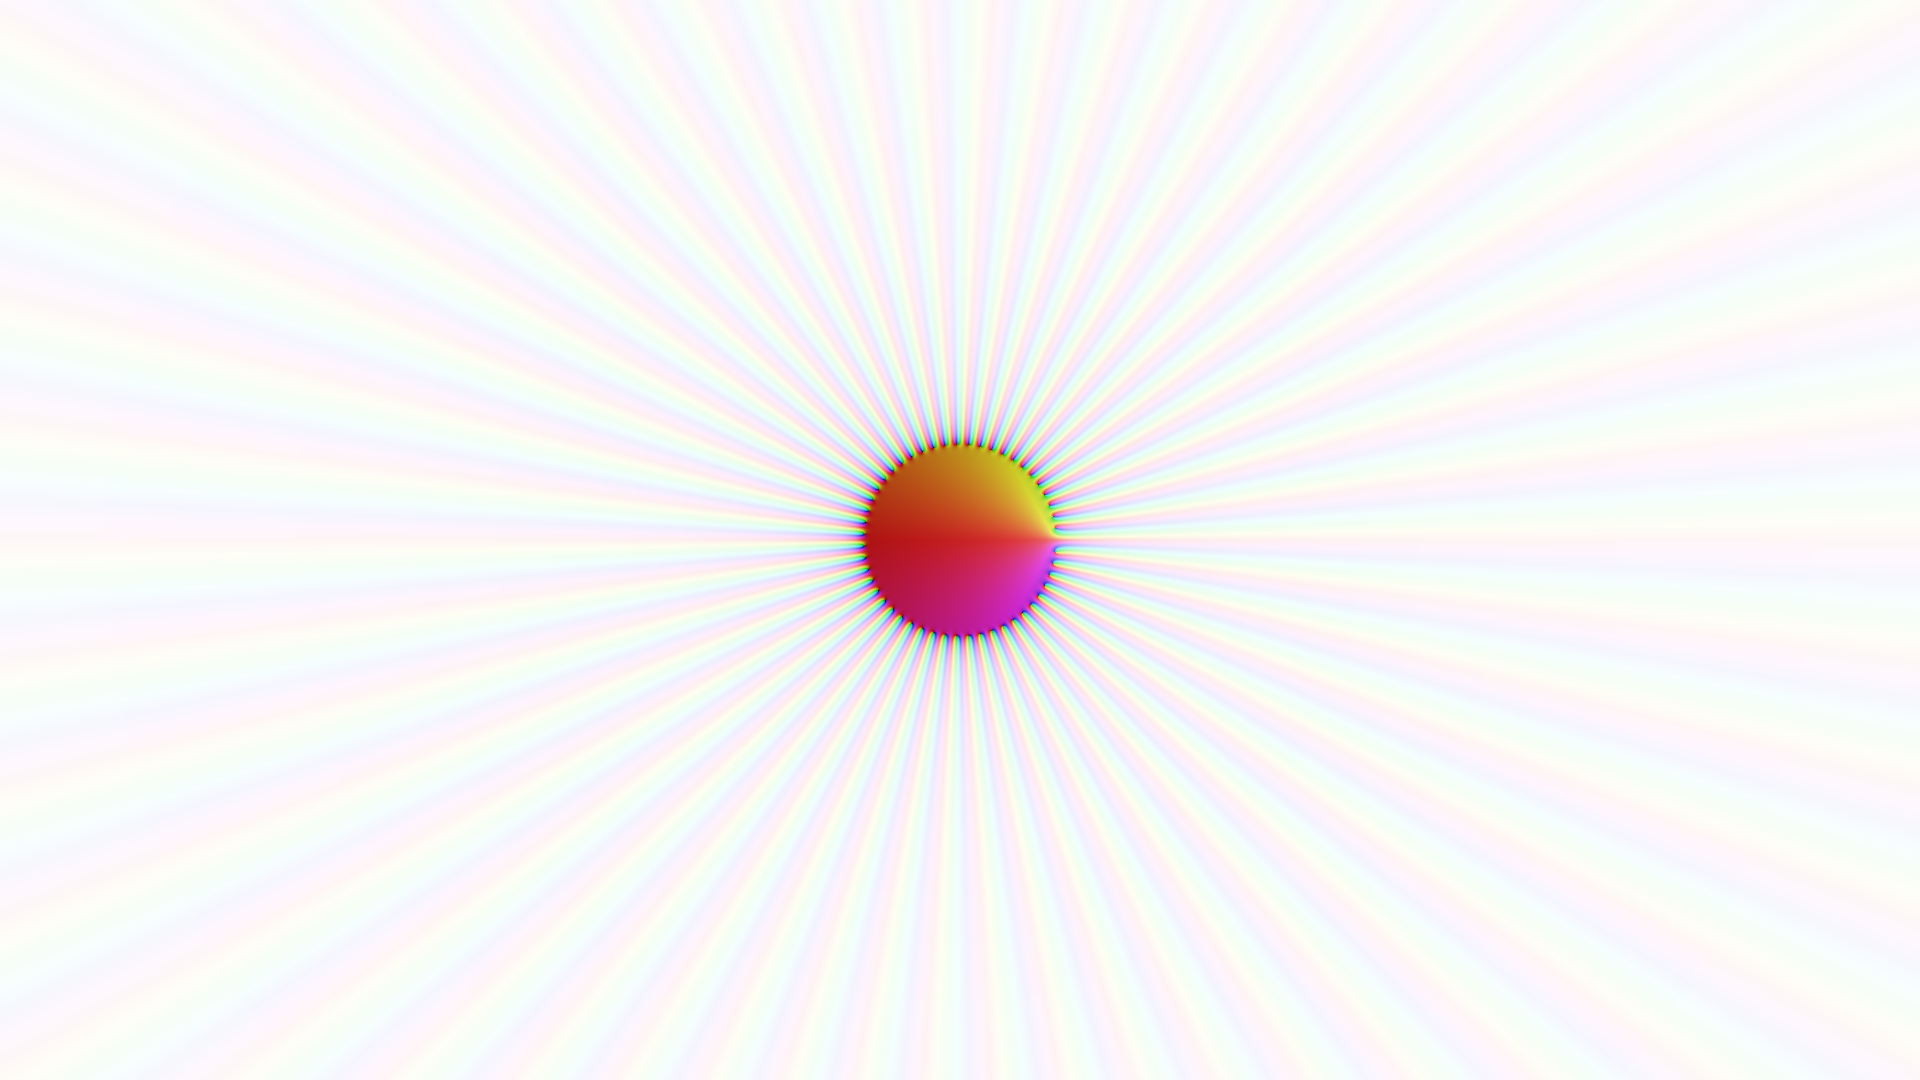
>>> f = SommeSérieEntière(lambda n : 1, N_MAX = 100)
>>> ReprésenterFonction(f)
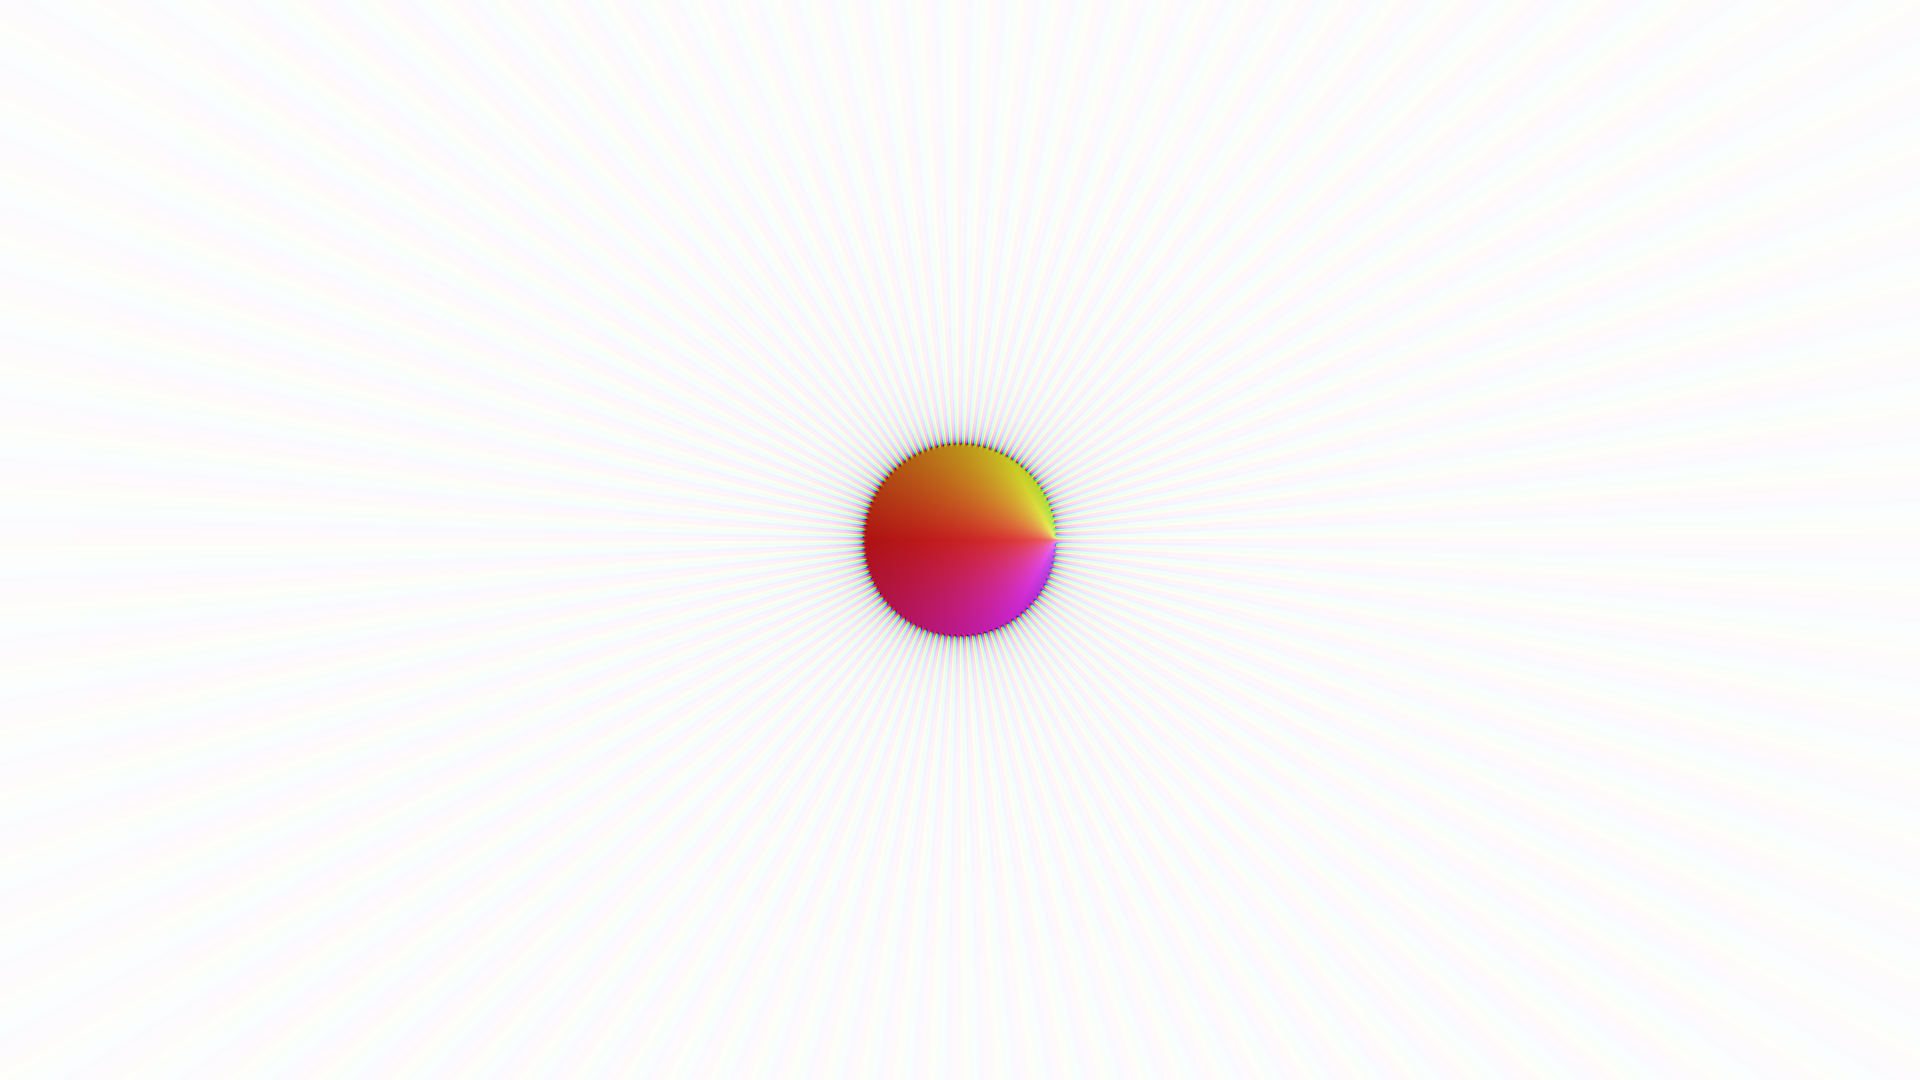
>>> Centrer(0.0, 0.0, 10.0)
>>> ReprésenterFonction(lambda z : 1 / (1 - z))